In the business world, key performance indicators (KPIs) are like a GPS for success. They show you where you are, tell you if you’re on the right track, and most importantly, tell you if you need to adjust your direction to get to your destination.
On social media, KPIs become even more vital, as measuring impact in a “noisy” digital space can be challenging. In this article, we’ll explore what the key performance indicators are in social media, how to choose them, and how to interpret them to achieve meaningful results.
What are KPIs in Social Media?
Imagine that social media is like a crowded marketplace, and your business is one of the stalls full of products. How do you tell if you’re noticed? If people visit your booth? What if I come back to buy? This is where KPIs come into play – those metrics that give you clear answers to the above questions.
Social media KPIs are quantifiable metrics that indicate how well your digital strategy is working. Whether we’re talking about the number of followers, engagement rate, or conversions, these metrics turn information chaos into a clear map of your online performance.
Why are KPIs important?
In a physical store, daily sales, the number of customers or direct feedback are natural indicators of success. In social media, everything is more abstract, and the lack of accurate measurements can leave you lost. KPIs give you the ability to measure not only success, but also understand how to optimize efforts.
For example, if you don’t have established metrics, there’s a chance you’ll invest time and money in creating content and campaigns without knowing if they’re getting results. With clear KPIs, you can adjust your strategy based on what works best.
Types of KPIs in Social Media
Key performance indicators can vary depending on your business goals. A general list of the most important of these online can be found in another blog article published by us.
Hubspot’s Social Media Marketing statistics demonstrate that 77% of marketers reported that their efforts were “effective or very effective” during the year, while only 37% were able to identify the causes of underperforming campaigns using social media analytics.
These statistics highlight the importance of properly measuring and monitoring the performance of marketing campaigns through relevant KPIs, especially on social media platforms. Metrics like engagement rate, click-through rate (CTR), and conversions are essential to understand what’s working and what’s not in a campaign. Without detailed monitoring and proper analysis of these numbers, it can be difficult for marketers to pinpoint the exact causes for poor campaign performance.
So, there are a number of specific KPIs for Social Media. Among them are:
Awareness KPIs
These metrics show how well your message reaches the audience and can be measured by:
- Reach (unique views), which is the unique number of people who have seen your content. Each person is counted only once, regardless of how many times they interacted or viewed your material.
- Impressions (total views), on the other hand, include all impressions of your content, regardless of whether it has been viewed by the same person more than once.
A simple example:
If a post is seen by 5 different people (reach = 5), but one of them sees it 3 times, the total number of impressions will be 7 (5 unique + 2 additional impressions).
KPIs for engagement
These metrics show how well your audience engages with your content:
- Interactions: This includes user reactions, such as likes, comments, shares, and other forms of engagement (e.g., link clicks). They indicate whether your audience finds the content interesting or relevant.
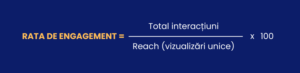
- Engagement rate: This is calculated as the ratio between the total number of interactions and reach (the unique number of people who saw the post). The result shows how engaged the audience is in relation to the size of the audience.
Example:
Let’s say you have a Facebook post:
- Reach: 1,000 unique people have seen the post.
- Interactions:
- Likes: 50
- Comments: 20
- Shares: 10
- Total interactions: 80
- Example:
Engagement rate = (80 / 1000) x 100 = 8
- An engagement rate of 8% suggests that the post was well received and generated interest from the audience. Such a value is considered above average on most social platforms, where the usual engagement varies between 1% and 5%.
This analysis helps you understand what type of content resonates with your audience and how to adjust your strategy.
KPIs for conversions
These metrics reflect the success of your campaigns in converting users from mere visitors into customers or active participants.
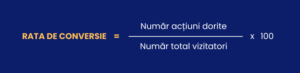
- Conversion rate: The percentage of users who complete a desired action, such as a purchase, filling out a form, or downloading an app.
- Formula:
Practical example:
- An online store attracts 2,000 visitors to a product page.
- Of these, 100 complete a purchase.
Conversion rate: = (100 / 2,000) × 100 = 5%
- Interpretation: A 5% conversion rate is very good for most industries, indicating that your marketing strategy is effective in guiding visitors to the desired action.
2. Cost per conversion (CPC): The average amount spent to drive a conversion, measuring the efficiency of the budget invested.
- Formula:

Practical example:
- You’ve spent $500 on an ad campaign to drive sales.
- The campaign brought 50 conversions.
CPC = 500 RON / 50 = 10 RON per conversion
- Interpretation: If the profit from a conversion exceeds $10, the campaign is profitable. Otherwise, it should be optimized to reduce costs or increase the conversion rate.
According to Ranktracker, “social media referrals account for 31.24% of referral traffic to a website.”
KPIs for loyalty
These metrics reflect how well you maintain your relationship with your existing audience:
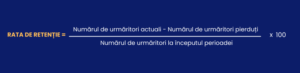
- Follower retention rate: The percentage of followers who continue to be with you during a certain period of time, without unfollowing your page or ignoring you.
- Formula:
Practical example:
- At the beginning of the month, you have 10,000 followers on Instagram.
- By the end of the month, you gain 500 new followers, but lose 200.
- Total number of current followers: 10,300.
Retention rate: = [(10,300 – 200) / 10,000] × 100 = 98%
- Interpretation: A retention rate of 98% shows excellent performance, indicating that most followers find your content relevant and engaging.
2. Return visitors: Measure how many of the users who interacted with your page come back to consume more content. It is an indicator of loyalty and interest in your brand.
Example:
- You manage an Instagram page for a fashion store.
- Within a week, your page has 5,000 unique visitors (people who have accessed your profile or interacted with your posts).
- Of those, 1,500 are people who visited or interacted with your page in the previous week.
- Percentage of returning visitors:
= (Number of returning visitors / Total unique visitors) × 100
= (1,500 / 5,000) × 100 = 30% - Interpretation: A 30% of visitors who return to social media suggest that a significant portion of your audience is loyal and finds your content valuable enough to return regularly.
These performance indicators cover the entire process, from capturing attention to turning your audience into loyal customers.
Online commerce in Romania continues to grow rapidly, and in 2023, 68% of Internet users made at least one online purchase, reflecting an increased appetite for this type of convenient shopping. However, in order to remain competitive, Romanian online stores must focus on creating dynamic and personalized content that attracts and retains consumers (GPeG Blog, 2024).
In this context, carefully analyzing social media performance through relevant KPIs, such as engagement, conversion rate, and follower growth, becomes crucial. Thus, monitoring dynamic content on social platforms can be beneficial for stores. With its help, they can quickly adjust strategies, identify opportunities and respond to changes in the market, especially in the face of increasing competition such as the wave of international players.
How to choose the right KPIs?
The right choice of key performance indicators depends on your business goals. You can follow these steps to select the numbers that provide you with the most relevant information:
Define the end goal
Determine what you want to achieve:
- Raising awareness: If the goal is to reach as many people as possible, the focus should be on reach and impressions.
- Sales Drive: If you’re tracking conversions, focus on conversion rate and cost per conversion (CPC).
Clarifying the main objective simplifies your indicator selection process.
Use the SMART principle for KPIs
In other words, make sure that the indicators comply with the SMART criteria:
- Specific: What measurements? (e.g.: likes, conversion rate, reach).
- Measurable: Indicators must be quantifiable (e.g.: 10% increase in followers).
- Accessible: Objectives must be realistic, depending on the budget, resources, but also the reality in the market. (E.g. 2% conversion rate for a fashion store).
- Relevant: Metrics should be in line with your business goals (e.g., engagement for community growth).
- Timeframe: A time frame should be set to evaluate progress (e.g., “over the next 3 months”).
Tailor KPIs for each platform
Each social platform works differently, and the relevant indicators vary depending on its specifics:
- Instagram: Focus on engagement (likes, comments, shares) and visual impact, as the platform is centered on aesthetic content.
- Facebook: Monitors reach, interactions, and direct conversions to gauge the success of campaigns.
- LinkedIn: Focus on connections, click-through rate on articles and leads, the platform being oriented towards networking and professional relationships.
Interpreting and optimizing KPIs
Measurement is only the first step, but the correct interpretation of the data is essential to understand performance and identify areas for improvement. Instead of just focusing on the absolute numbers, it’s important to look at long-term trends.
For example, steady, albeit slower, growth may be more sustainable than a temporary burst of results that may not be sustained. Moreover, it is important to constantly test and adjust.
If a metric isn’t showing significant improvements, it’s time to change the strategy, whether it’s changing your target audience in a campaign, different types of content, or even adjusting the posting time. Also, compare the performance between different types of posts and campaigns to understand what works best and focus on those strategies that bring you the best results.
KPIs are not just numbers, indicators signify your performance in the digital world. Choosing and following them correctly can turn a chaotic social media strategy into one that brings tangible results.
As an entrepreneur, treat key performance indicators with the seriousness with which you treat cash flow, turnover or customer satisfaction. They’re not just numbers in your reports, they’re the key to an online presence that makes a difference in your business.
At Klain, we constantly follow the relevant figures on social media. We make monthly reports on constant communication, adjusting it according to the results obtained. Moreover, we monitor the results of your paid campaigns weekly or even daily, making improvements for their optimization.